How many jobs can be reached by transit?
The map below illustrates the significant decrease in the number of jobs reachable by transit if service is reduced by 35%. These impacts are not distributed evenly across the region. Instead, they are highly localized, with some neighborhoods and communities losing access to thousands of jobs within a reasonable transit commute. In many cases, areas that already have limited transportation options would be hit hardest, deepening existing inequities.
This diminished access could have real consequences for employers as well as workers. Businesses located in affected areas, particularly in job centers outside of Downtown such as the North Hills, Robinson, Monroeville, and parts of the Mon Valley, may find it more difficult to attract and retain employees who rely on transit. Fewer accessible jobs means fewer opportunities for residents, and a smaller available labor pool for employers. In a tight labor market, this could hinder growth, limit hiring, and disrupt operations across sectors ranging from healthcare and logistics to retail and hospitality.
This isn’t just a transportation issue. It’s an economic one. Without adequate transit, the connection between people and jobs weakens, and the regional economy suffers.
How has transit access to jobs changed over time?
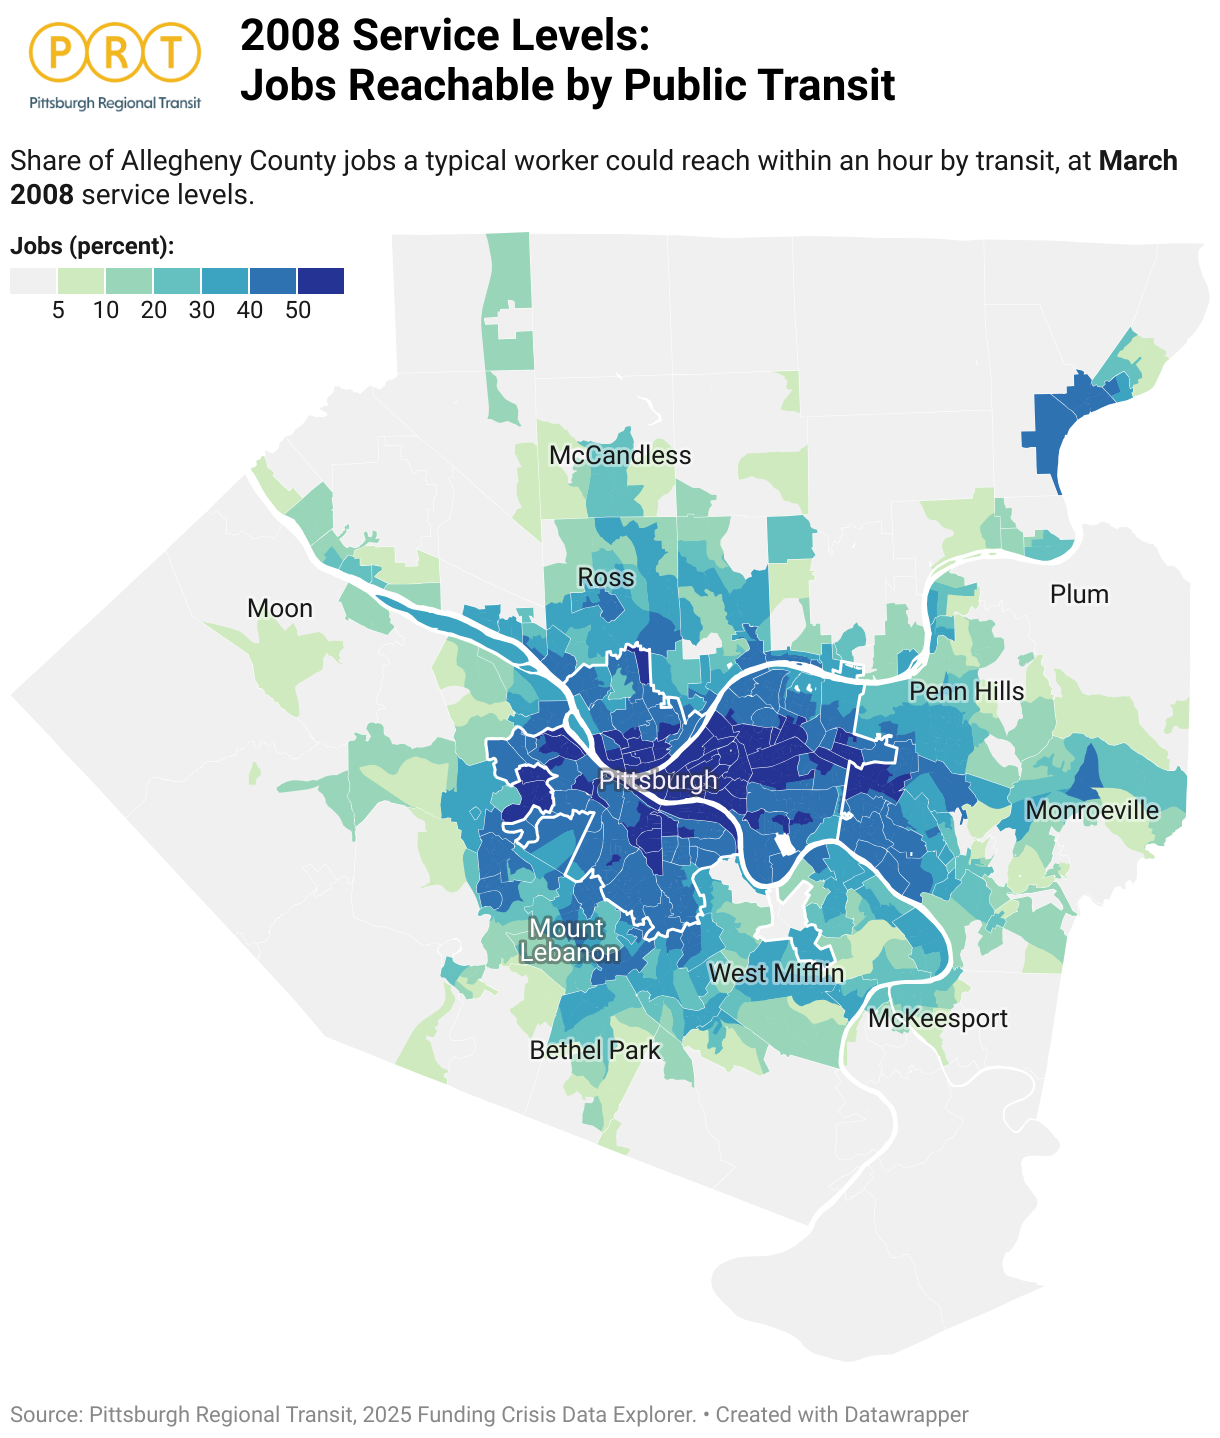
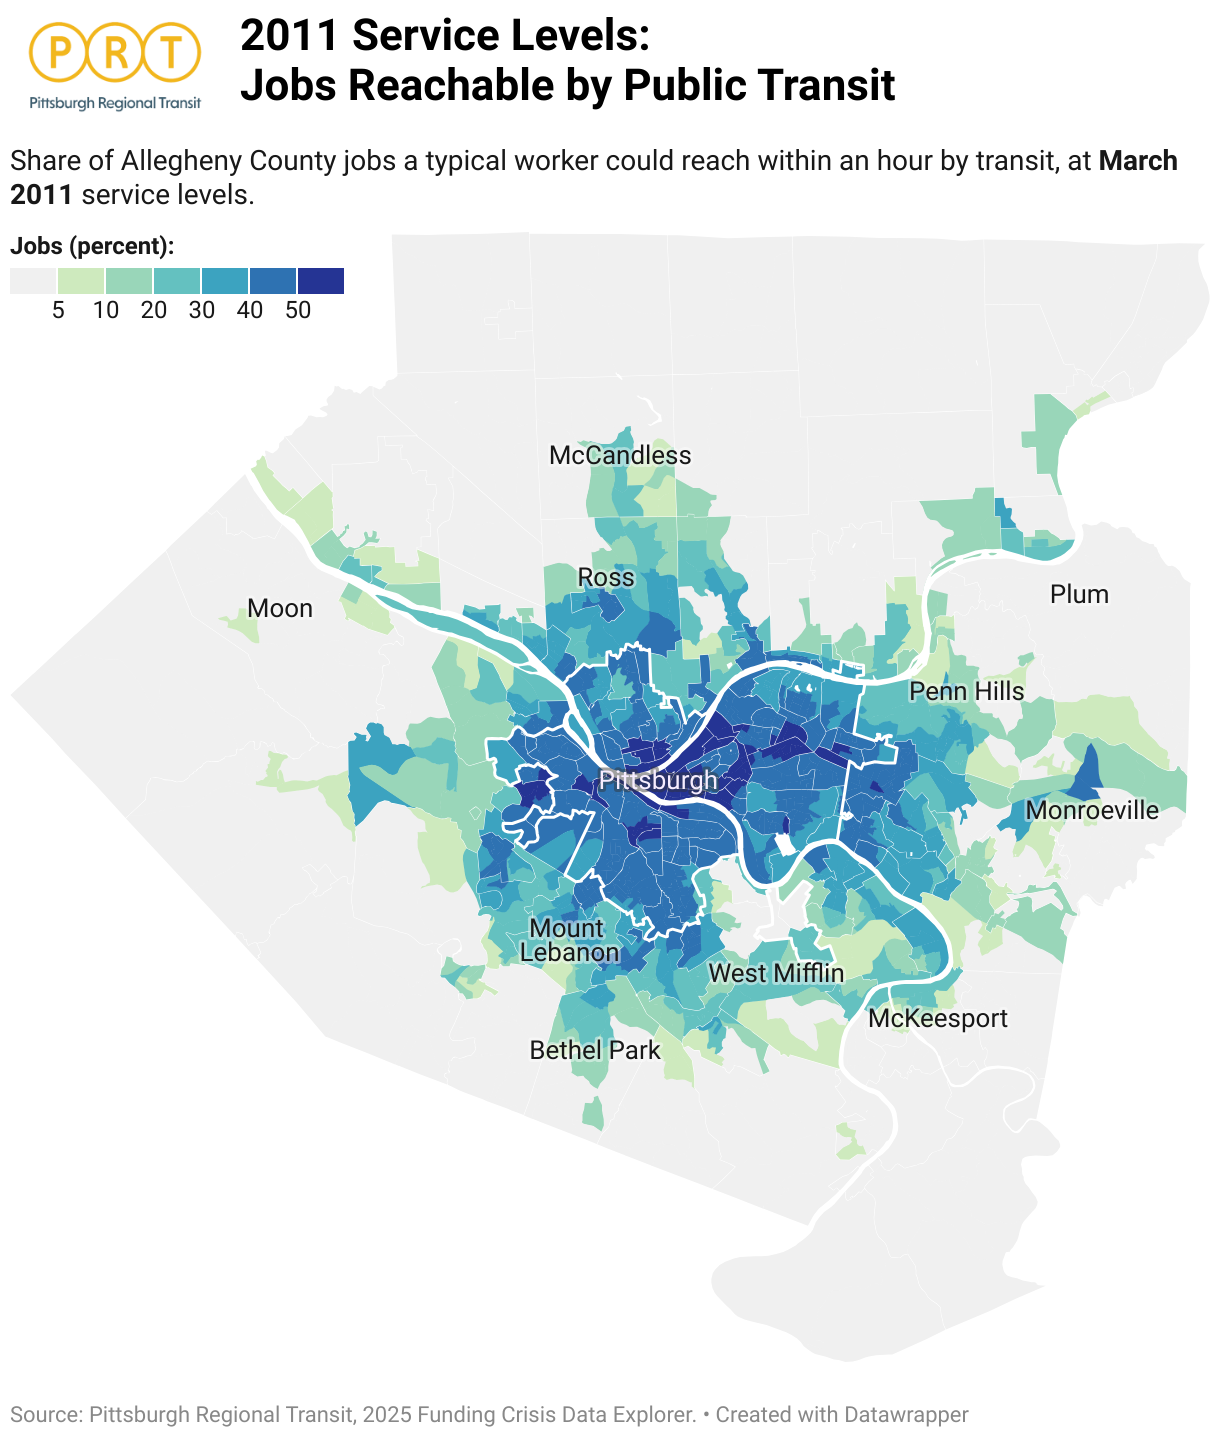
Over the last 20 years, PRT has had to respond to a series of budget cuts that have resulted in 36% less service, and about half as many transit riders as the agency once served. These cuts have resulted in PRT's service area shrinking, and frequency cuts that have increased travel times - meaning that fewer destinations are accessible to riders. In 2024, a typical Allegheny County worker riding public transit could reach about 120,000 jobs in an hour or less on weekdays - about 38% fewer jobs than the same worker could reach at PRT's 2008 service levels.
Use the maps and interactive dashboard below to see how service cuts since 2008 have affected the number of jobs a typical worker can reach from different communities in Allegheny County:
2008 System
2011 System
2019 System

2024 System

2026 Proposed (-35%)

Download these maps:
How has my municipality's or Pittsburgh neighborhood's access changed?
Use the drop-down menu below to explore changes to job access from different municipalities and City of Pittsburgh neighborhoods and what further reductions may occur if a state funding solution is not identified.
Notes on Methodology
- Public transit travel time includes the entire period between starting a trip and arriving at a destination, including time spent on a vehicle, wait time, and walk time.
- For the purpose of this analysis, a public transit trip can include any combination of walking + transit. In communities with no transit service, the number of jobs reachable by transit will equal the number of jobs within walking distance.
- To estimate the number of jobs reachable by transit, travel times were repeatedly calculated from each census block group to every other census block group in Allegheny County for the peak weekday service period from 7 am to 8 am. The average number of jobs reachable from each block group was calculated as: [total jobs located in destination block group * frequency that the destination is reachable in 60 minutes or less]. For example, if a destination block group with 1000 jobs is accessible 40% of the time, the number of jobs is calculated as [1000 * 0.4 = 400]. Those totals were then summed for all destinations to provide the job access score for the origin census block group.
- Job scores for municipalities and neighborhoods are an average of the scores for all block groups within the municipality/ neighborhood, weighted by the number of workers per block group.
- This analysis measures what job access would look like in present-day Allegheny County with different levels of historical service. Current (CY2022) origin/destination data for workers and jobs was used for all calculations.
- Scheduling data was obtained from historical GTFS feeds for the PRT/PAAC network from 2008 to 2024, and the current GTFS feed effective February 2025.
Data sources:
- Workers and Jobs: US Census Bureau 2022 LEHD Residence Area Characteristics (RAC) and Workplace Area Characteristics (WAC) files;
- Service and Schedules: Port Authority pf Allegheny County GTFS feeds 2008-2025; PRT 35% service cut proposal.


